Passive Solar Basement Efficiency
Click on the graph for a larger version.
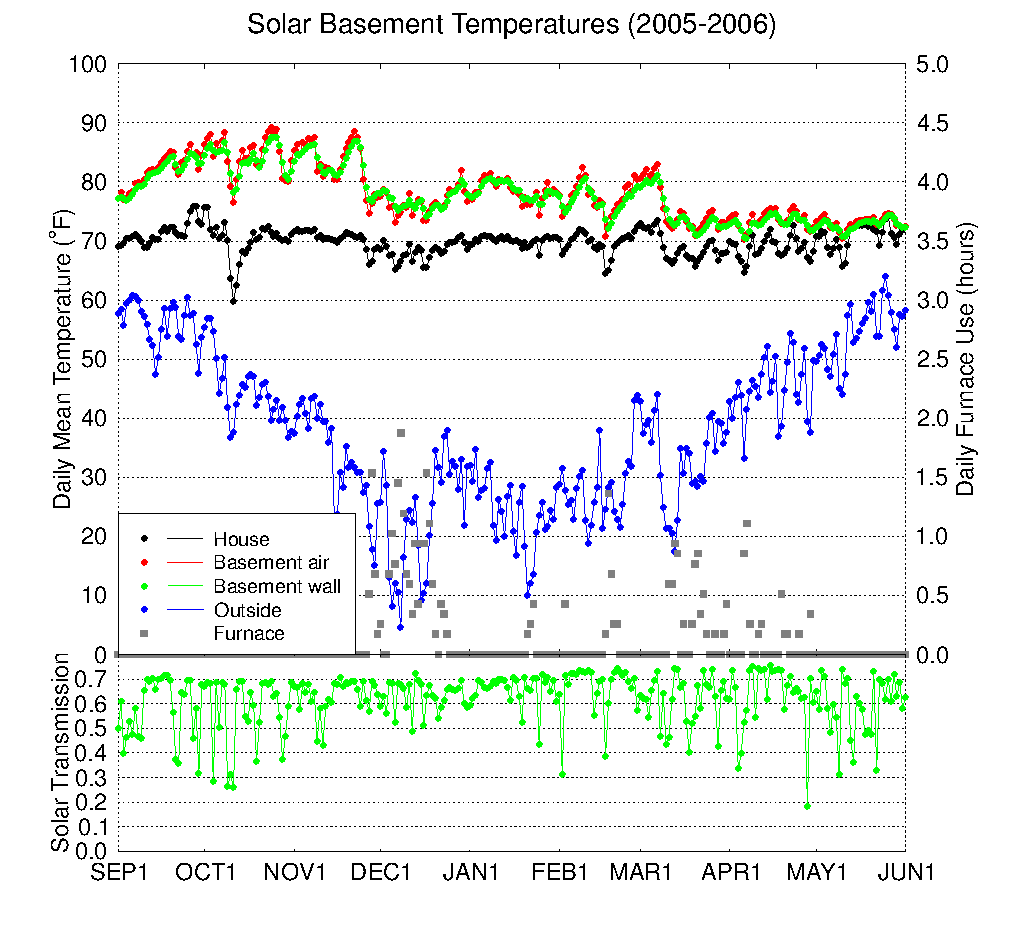
In September and October there was a fairly steady rise in basement temperatures as the sun moved lower in the sky and the solar energy was absorbed in the basement. There was a period of three cold and cloudy days in mid-October when the average house temperature dropped below 65oF because we were not at home and closed vents prevented heat transfer from the basement. Most of November was sunny and the basement temperature remained above 80oF. However, while we were away over Thanksgiving (late November) the automatic basement window insulation system malfunctioned, causing 1.5 days of sun to be blocked from heating the basement. This malfunction, along with the following cold weather, caused the basement temperatures to drop into the 70s and required the first use of the propane backup furnace. December, January, and February were rather sunny, and it was quite warm at the end of February. Thus we used the backup furnace very little in the winter. As the sun rose higher in the sky in spring, much less solar energy was captured in the basement (due to the vertical windows), and there was significant furnace use during cold or cloudy periods.
To improve the solar heating performance, the computer control implements a ramping thermostat, with the desired temperature increasing smoothly from 65oF at 8:00 am (usually) to 75oF at 4:00 pm MDT, with a decrease during the night. This makes the solar heating much more effective because it transfers heat to the house when the basement is warmest. The backup furnace thermostat is set to 65oF during the day and 60oF from 9:00 pm to 6:00 am. The computer operates the backup furnace within a ±1.0K temperature range around the desired minimum temperature.
Click on the graph for a larger version.