Passive Solar Basement Efficiency
Click on the graph for a larger version.
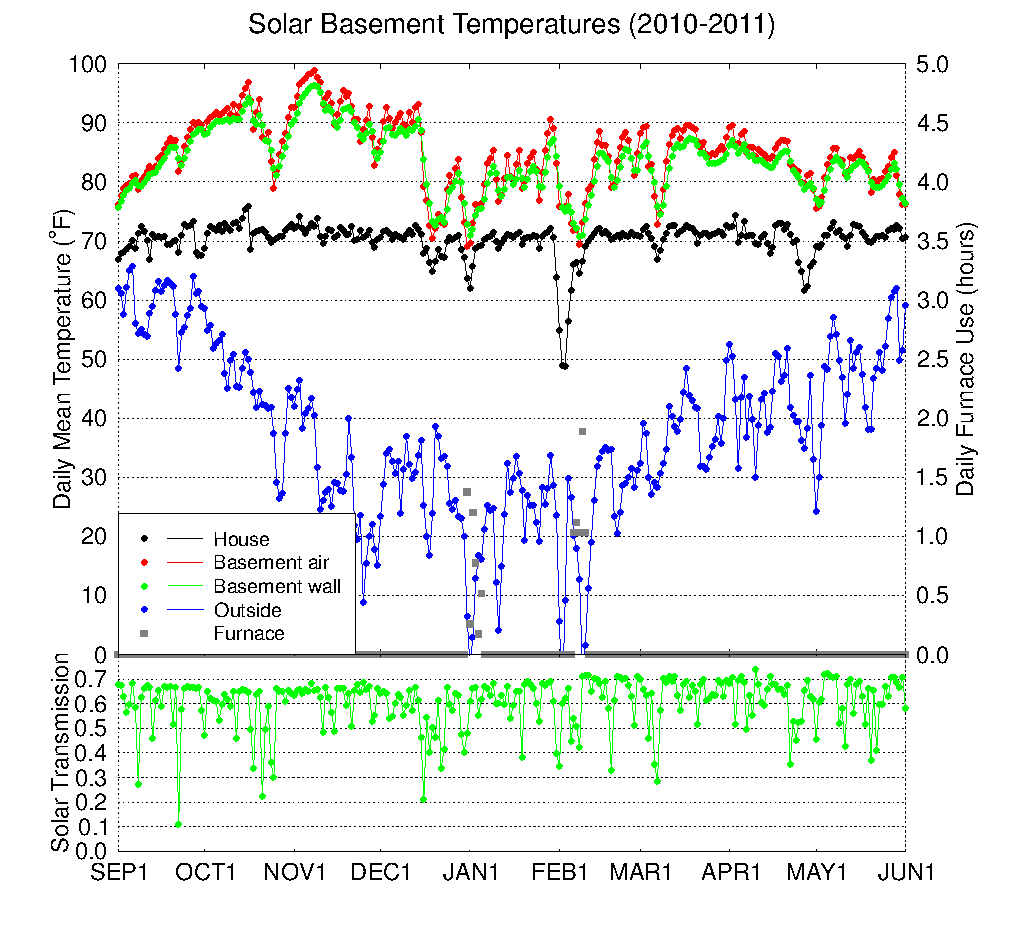
It was a relatively warm season, except for three few day periods of wicked cold. During the first cold snap around New Years frozen water vapor in the propane tank prevented the furnace from working and the house got colder than desired. During the second cold snap in early February we were away and let the house get quite cold, though we were at home for the third cold snap a week later. The furnace only ran for around the time of the two cold snaps when we were home. We were also away in late April and let the house cool down.
Due to the reflectors in front of the basement windows, the basement air temperature usually averaged above 80o, except during extended cloudy periods. Since the basement was warmer than in past years we needed to close the basement vents during sunny periods and even occasionally open the windows on warmer afternoons. About once a month from early February to early May we increased the tilt of the reflectors from 0o to 28o to follow the increasing solar elevation angle. On May 29 we tilted the reflectors back down to 0o and the basement cooled off rapidly over the next few days.
Click on the graph for a larger version.
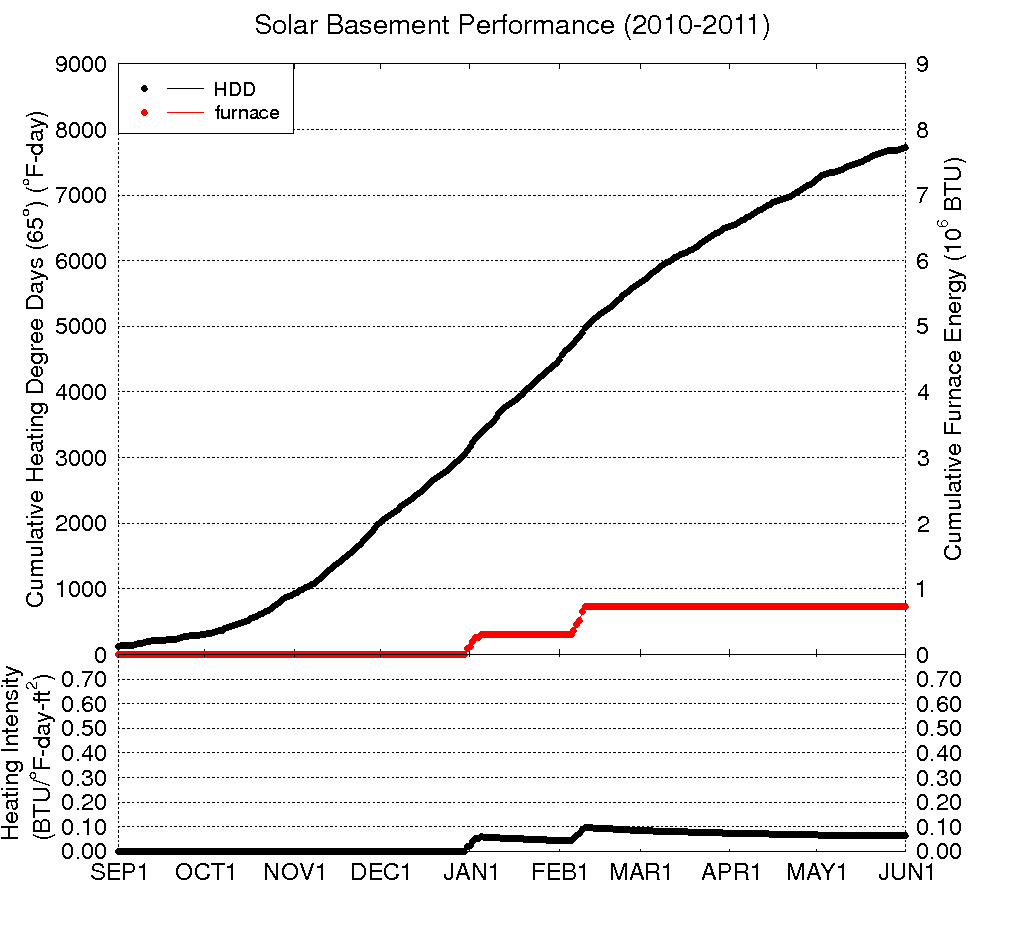
This season the furnace was used for 10.4 hours, consuming about 8 gallons of propane. The ratio of BTUs to heating degree days divided by the floor area of the house (1508 square feet) is plotted in the lower panel. This ratio is called the heating intensity index, and is a measure of how efficient the house is.