Passive Solar Basement Efficiency
Click on the graph for a larger version.
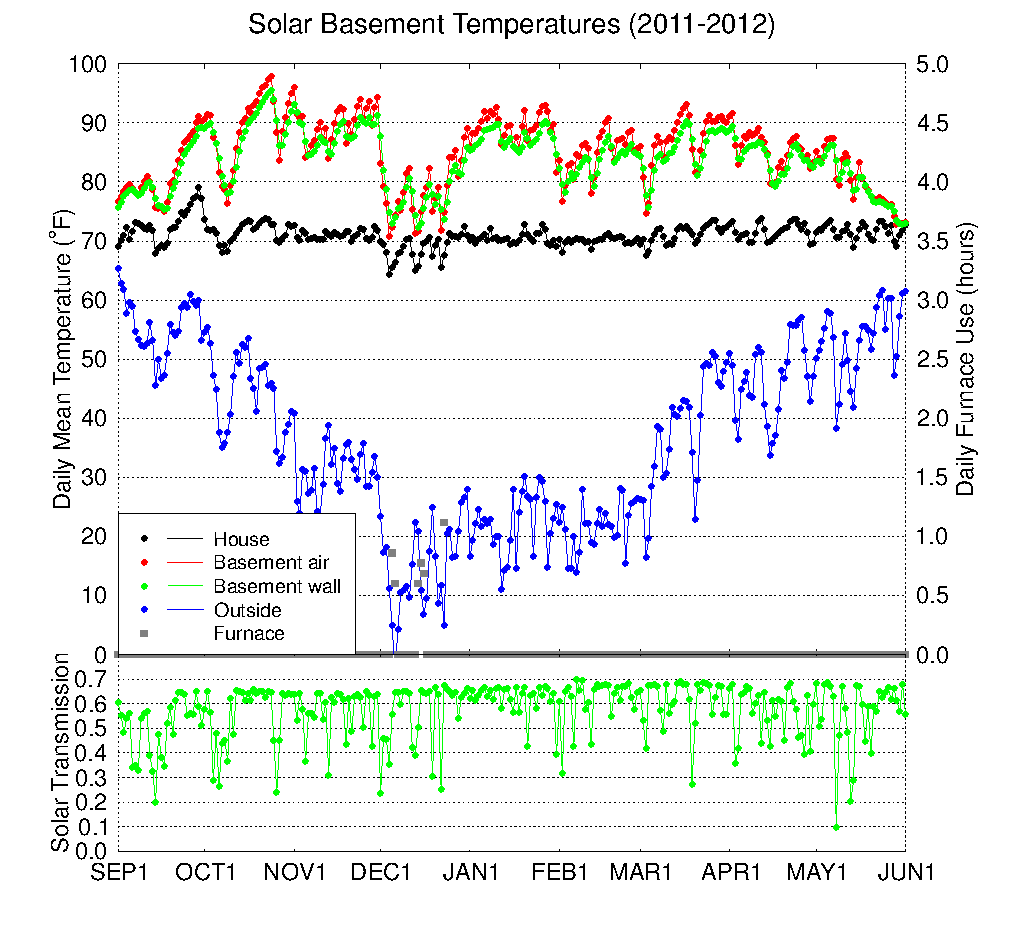
It was a relatively warm season, except for the cold snap in early December. December was the only time that the basement temperatures were below 80o for a sustained period, and even then most of the heat for the house came from the basement. Like last year we had some problems with propane at the coldest temperatures, though this year the problem seemed to be the regulator. With some warming of the regulator we were able to run the the furnace most days we needed to. The house overheated at the end of September when the outside temperature was warm and we were not home to open the windows. We tilted the reflectors back to level on May 15 before we left on a trip, and the basement temperatures fell rapidly. Keeping the window insulation down during the day starting on May 28 further reduced the basement temperatures. We tilted the reflectors earlier this year, about a week before the end of the month from January through April, which seemed to work well.
Click on the graph for a larger version.
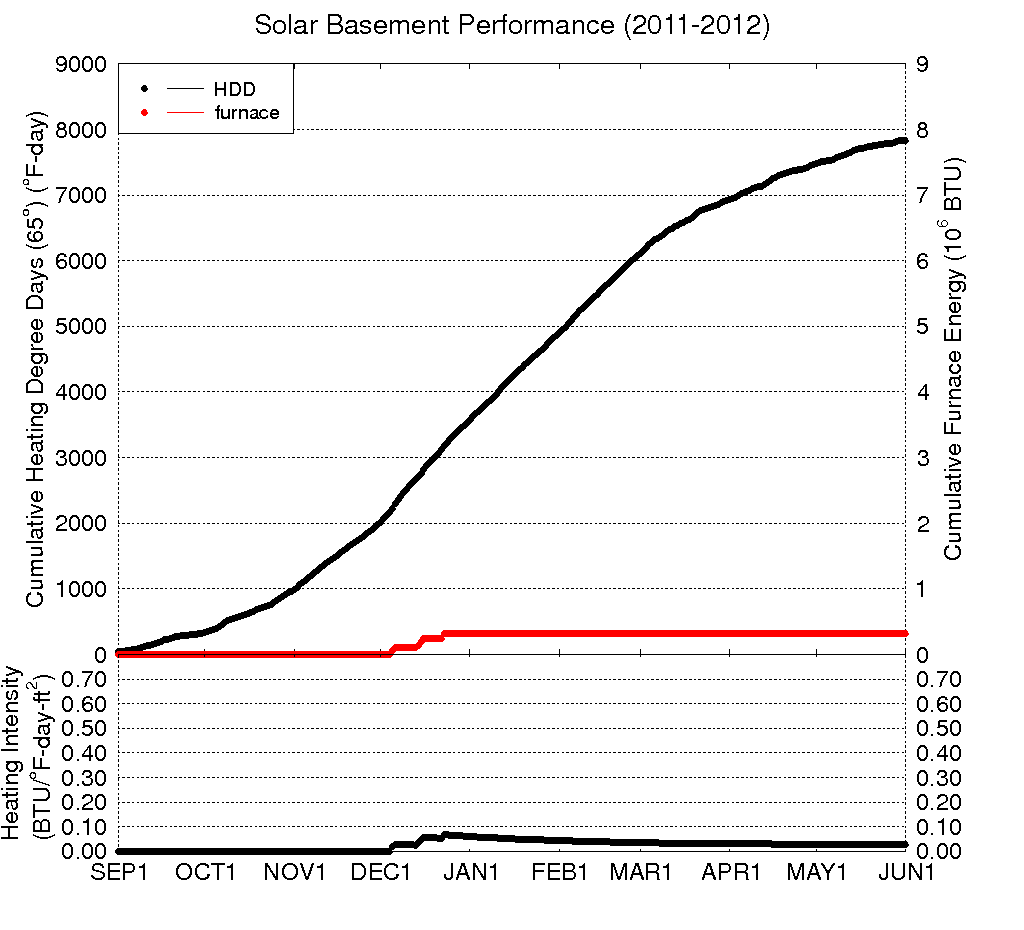
This season the furnace was used for 4.6 hours, consuming about 3.6 gallons of propane. The ratio of BTUs to heating degree days divided by the floor area of the house (1508 square feet) is plotted in the lower panel. This ratio is called the heating intensity index, and is a measure of how efficient the house is.