Passive Solar Basement Efficiency for the 2004-2005 Season

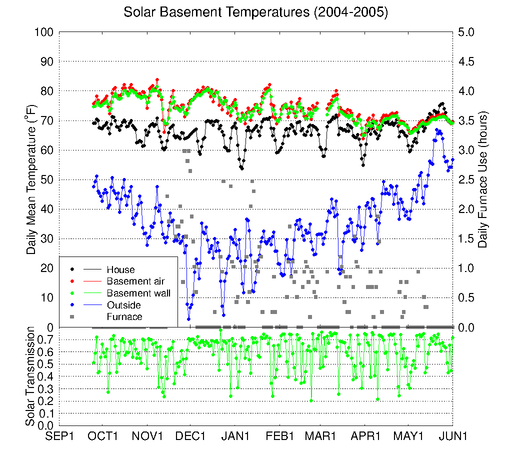
Click on the graph for a larger version.
There are some periods during which we lowered the thermostat and disabled the furnace, because we were not home. During cloudy periods the basement cools and becomes progressively less effective at heating the house. In mid-December we started using insulation at night in the house windows. In early December we switched operation of the basement-to-house fan from a conventional fixed thermostat to a ramping thermostat, with the desired temperature increasing linearly from 65oF at 8:00 am to 75oF at 4:00 pm, with a linear decrease during the night. This made the solar heating much more effective because it transfered heat to the house when the basement is warmest. The backup furnace thermostat is set to 65oF during the day and 60oF from 9:00 pm to 6:00 am.

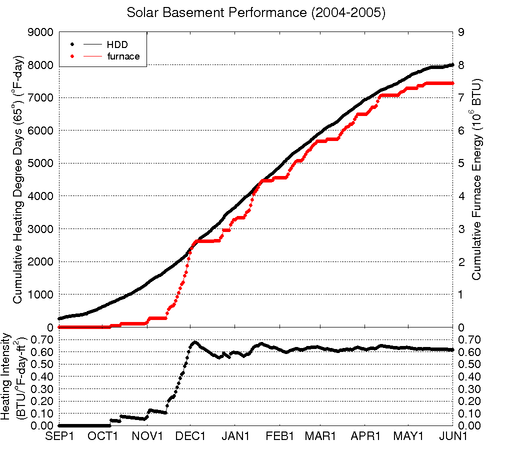
Click on the graph for a larger version.
To compare the furnace fuel consumption with a control house without a solar basement, we used the Home Energy Saver (HES) web application provided by Lawrence Berkeley Laboratory. This application has a fairly sophisticated treatment of energy use in a house, including detailed geometry, orientation, window and window insulation specifications, roof and wall insulation, and the local climate. We used the average house temperature (65.7oF) for the thermostat setting. HES predicted that our house without the solar basement would use 930 gallons of propane for heating in an average year. This estimate seems high based on our experience of furnace use when the basement was not heating the house. We converted the HES estimated fuel use to the energy intensity index using the standard HDD for the weather station used by HES (Alamosa). This heating intensity index is 6.5 BTU/(oF-day-ft2). If this estimate for the control house is accurate then our house this year was about 90% solar heated.