Passive Solar Basement Efficiency
Click on the graph for a larger version.
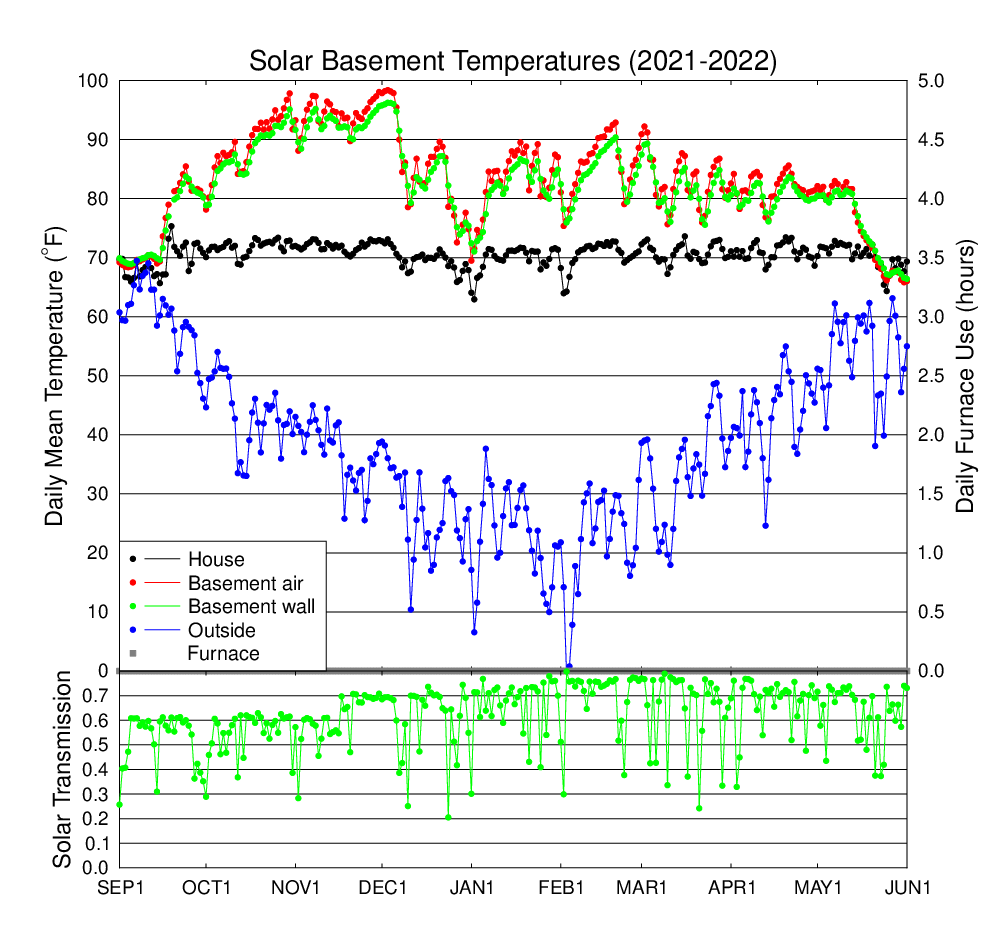
The graph above shows the observed daily average temperatures for the 2021-2022 heating season. The grey squares (along with the y axis on the right edge of the plot) show how many hours per day the backup propane furnace ran. The lower graph shows the ratio of daily average surface solar flux to the top of atmosphere solar flux. The surface solar flux on a horizontal plane is measured by the weather station, and the top of atmosphere solar flux is calculated for the date and location. Sunny days have a solar transmission above 0.7 (with the new solar sensor after Nov 16), and cloudy days have lower values.
We tried a new procedure this heating season by not running the furnace at all, and seeing how low the house temperature fell. The daily average house temperature fell below 65oF on five days, with the coldest being 62.9o in early January. One of these days was in May after we used the reflectors to block the sunlight from entering most of the basement on May 14 (perhaps too early). The house temperature would have been warmer during the early February cold snap, but the power supply for the basement circulation fan failed in late January, and a solution took about a month. (The solution was a new brushless fan motor and a new switching 24V DC power supply.)
Click on the graph for a larger version.
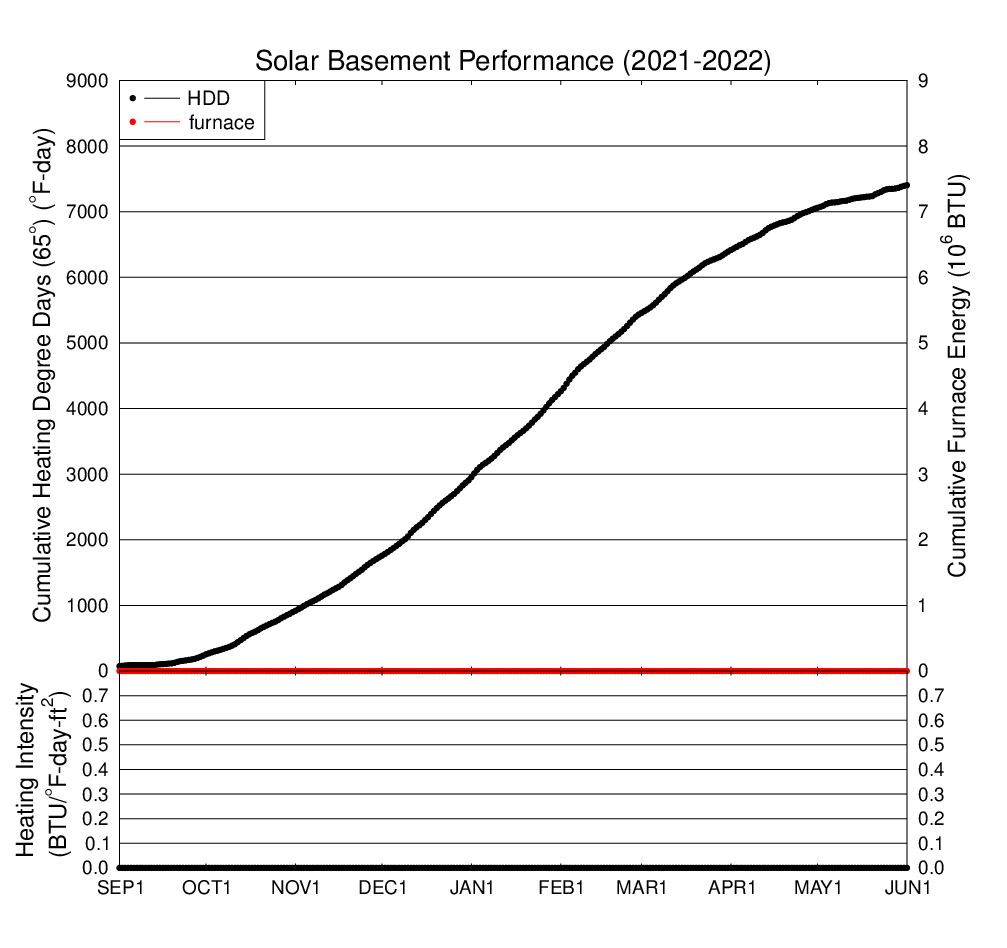
The above graph shows the total heating degree days (HDD) accumulated
through the season and total BTUs provided by the propane furnace in our
house. These HDD are defined relative to the standard 65oF. We chose to not run the house furnace, so the heating intensity
index (ratio of furnace BTUs to heating degree days divided by the floor
area of the house) is also zero.