Passive Solar Basement Efficiency
Click on the graph for a larger version.
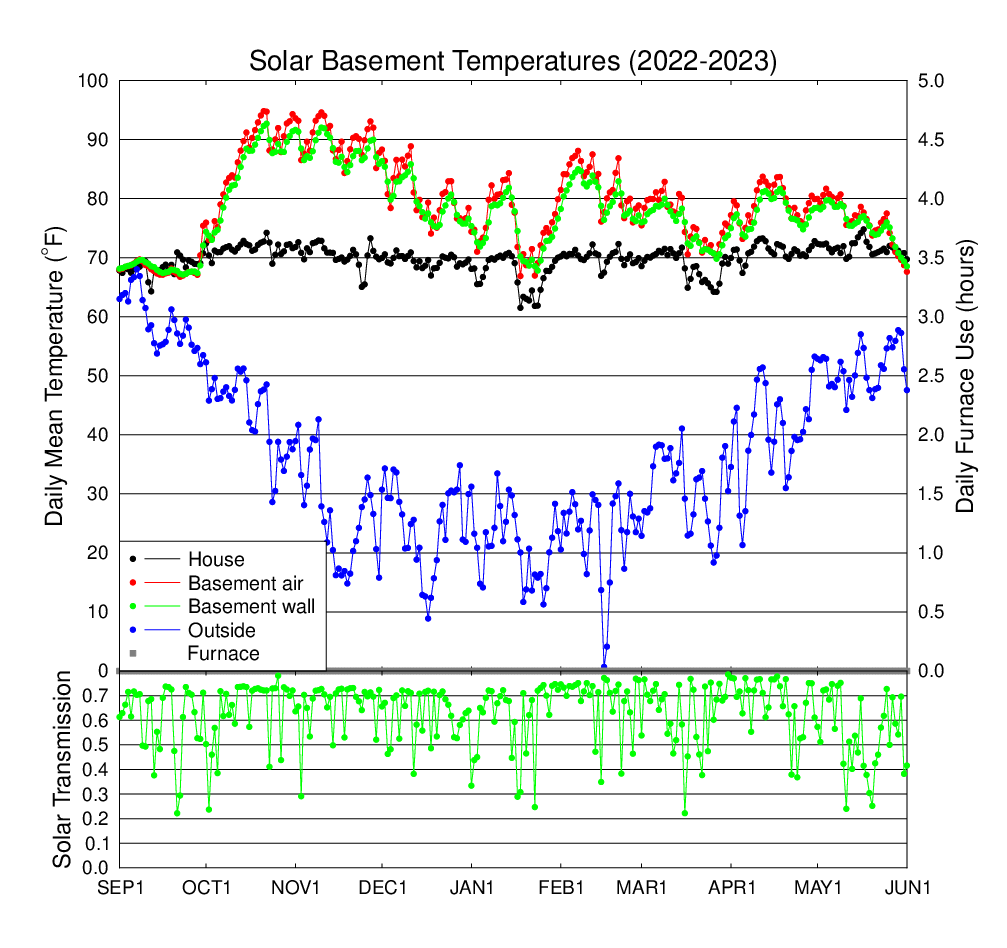
The graph above shows the observed daily average temperatures for the 2022-2023 heating season. The grey squares (along with the y axis on the right edge of the plot) show how many hours per day the backup propane furnace ran. The lower graph shows the ratio of daily average surface solar flux to the top of atmosphere solar flux. The surface solar flux on a horizontal plane is measured by the weather station, and the top of atmosphere solar flux is calculated for the date and location. Sunny days have a solar transmission above 0.7, and cloudy days have lower values.
We continued the new procedure this heating season by not running the furnace at all, and seeing how low the house temperature fell. The daily average house temperature fell below 65oF on 13 days, with the coldest being 61.5o in January. There were more indoor cold days this season than the previous season (5 days) because the outside temperature was colder (higher degree days) and cloudier when cold. We plan on running the furnance next year.
Click on the graph for a larger version.
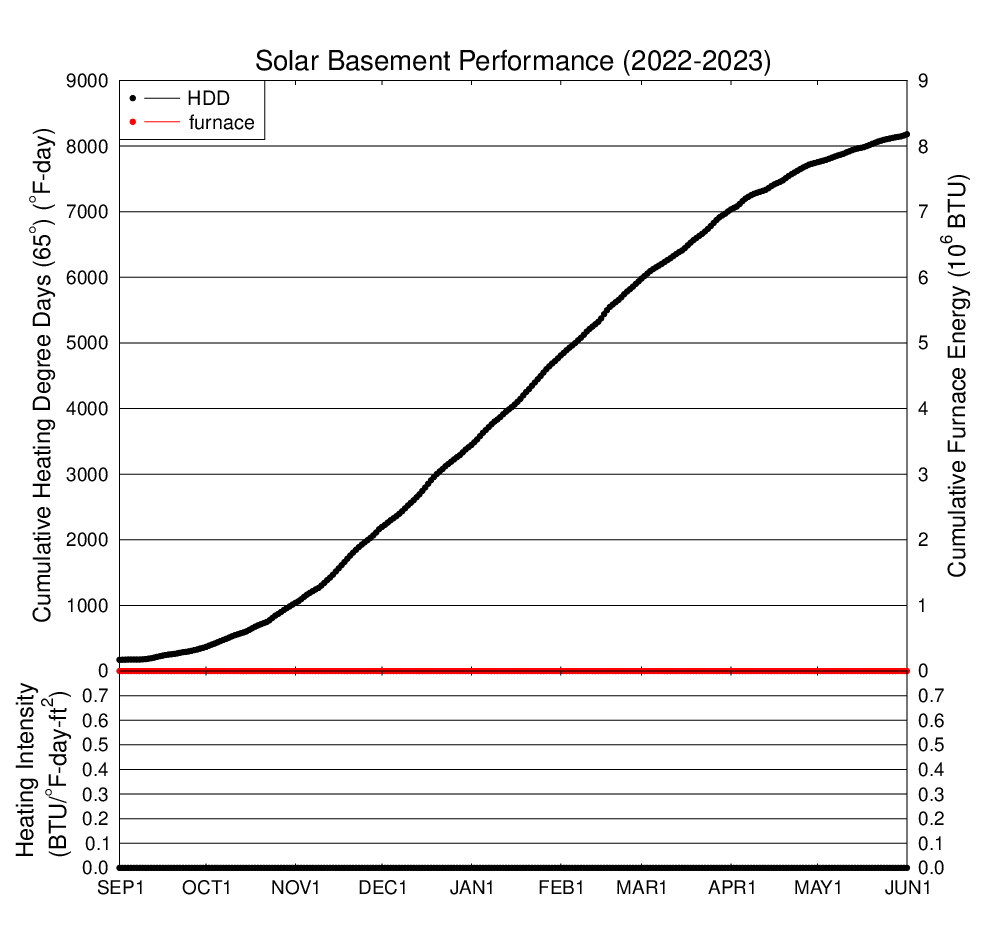
The above graph shows the total heating degree days (HDD) accumulated
through the season and total BTUs provided by the propane furnace in our
house. These HDD are defined relative to the standard 65oF. We chose to not run the house furnace, so the heating intensity
index (ratio of furnace BTUs to heating degree days divided by the floor
area of the house) is also zero.