Passive Solar Basement Efficiency

Click on the graph for a larger version.
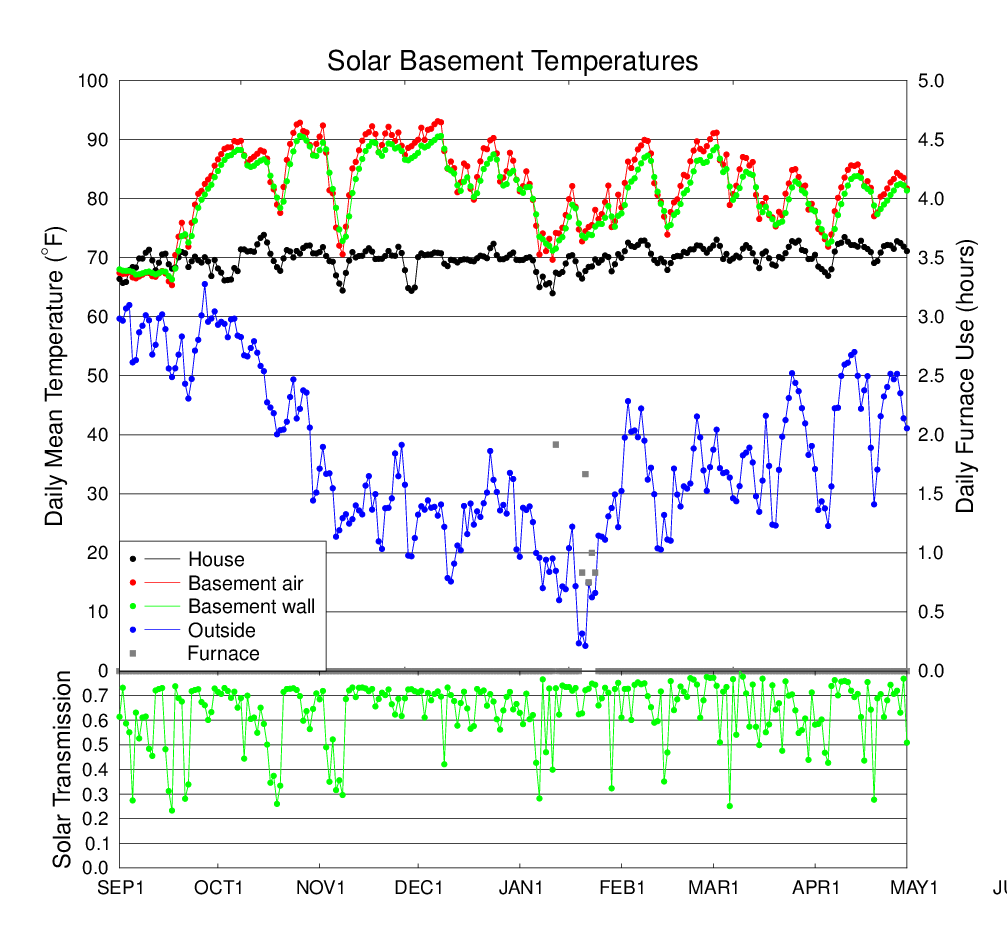
The graph above shows the observed daily average temperatures for this
heating season. The grey squares (along with the y axis on the right
edge of the plot) show how many hours per day the backup propane furnace
ran. The lower graph shows the ratio of daily average surface solar
flux to the top of atmosphere solar flux. The surface solar flux on a
horizontal plane is measured by the weather station, and the top of
atmosphere solar flux is calculated for the date and location. Sunny
days have a solar transmission above 0.7, and cloudy days have lower
values.
To improve the solar heating performance, the computer control
implements a ramping thermostat, with the desired temperature increasing
smoothly from 65oF at 8:00 am to 73 - 75oF at
4:00 pm MST, with a decrease during the night. This makes the solar
heating much more effective because it transfers heat to the house when
the basement is warmest.

Click on the graph for a larger version.
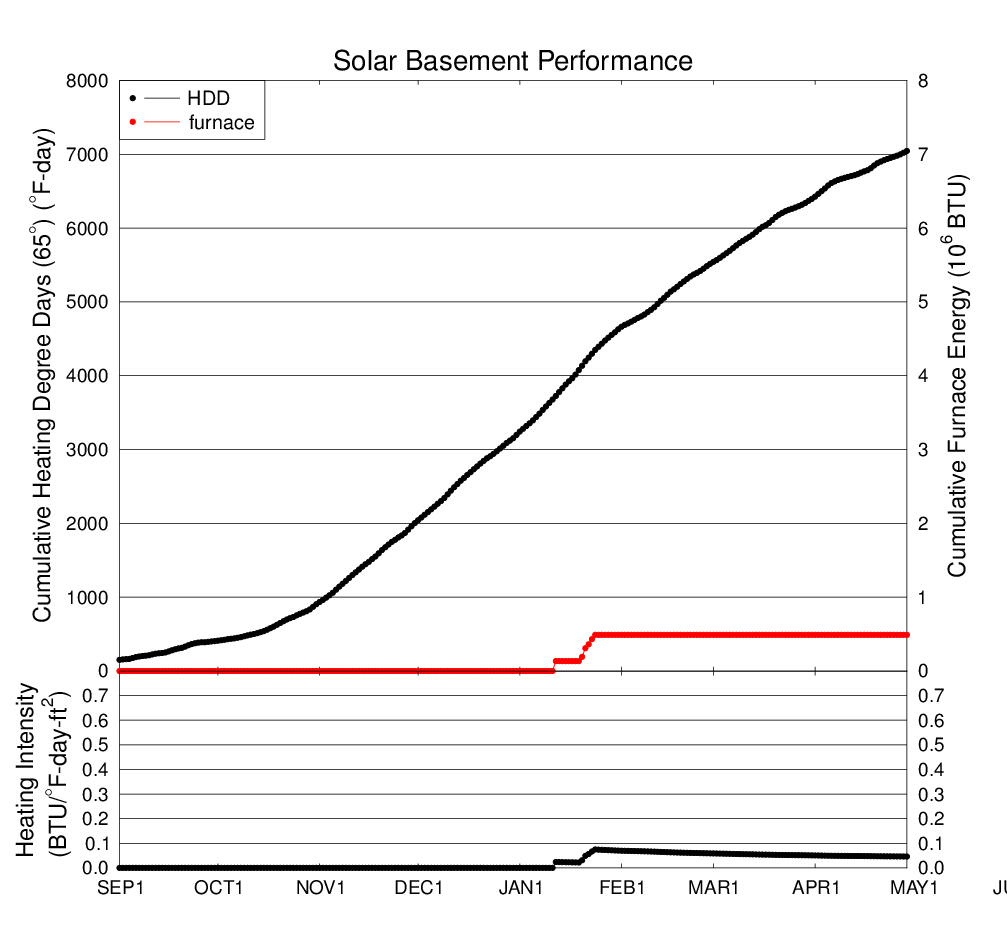
The above graph shows the total heating degree days (HDD) accumulated
through the season and total BTUs provided by the propane furnace in our
house. These HDD are defined relative to the standard 65oF.
The furnace BTUs are calculated using the 70,000 BTU/hour furnace rating
and the time the furnace is on as measured by the computer. The ratio
of BTUs to heating degree days divided by the floor area of the house
(1508 square feet) is plotted in the lower panel. This ratio is called
the heating intensity index, and is a measure of how efficient the house
is.
|